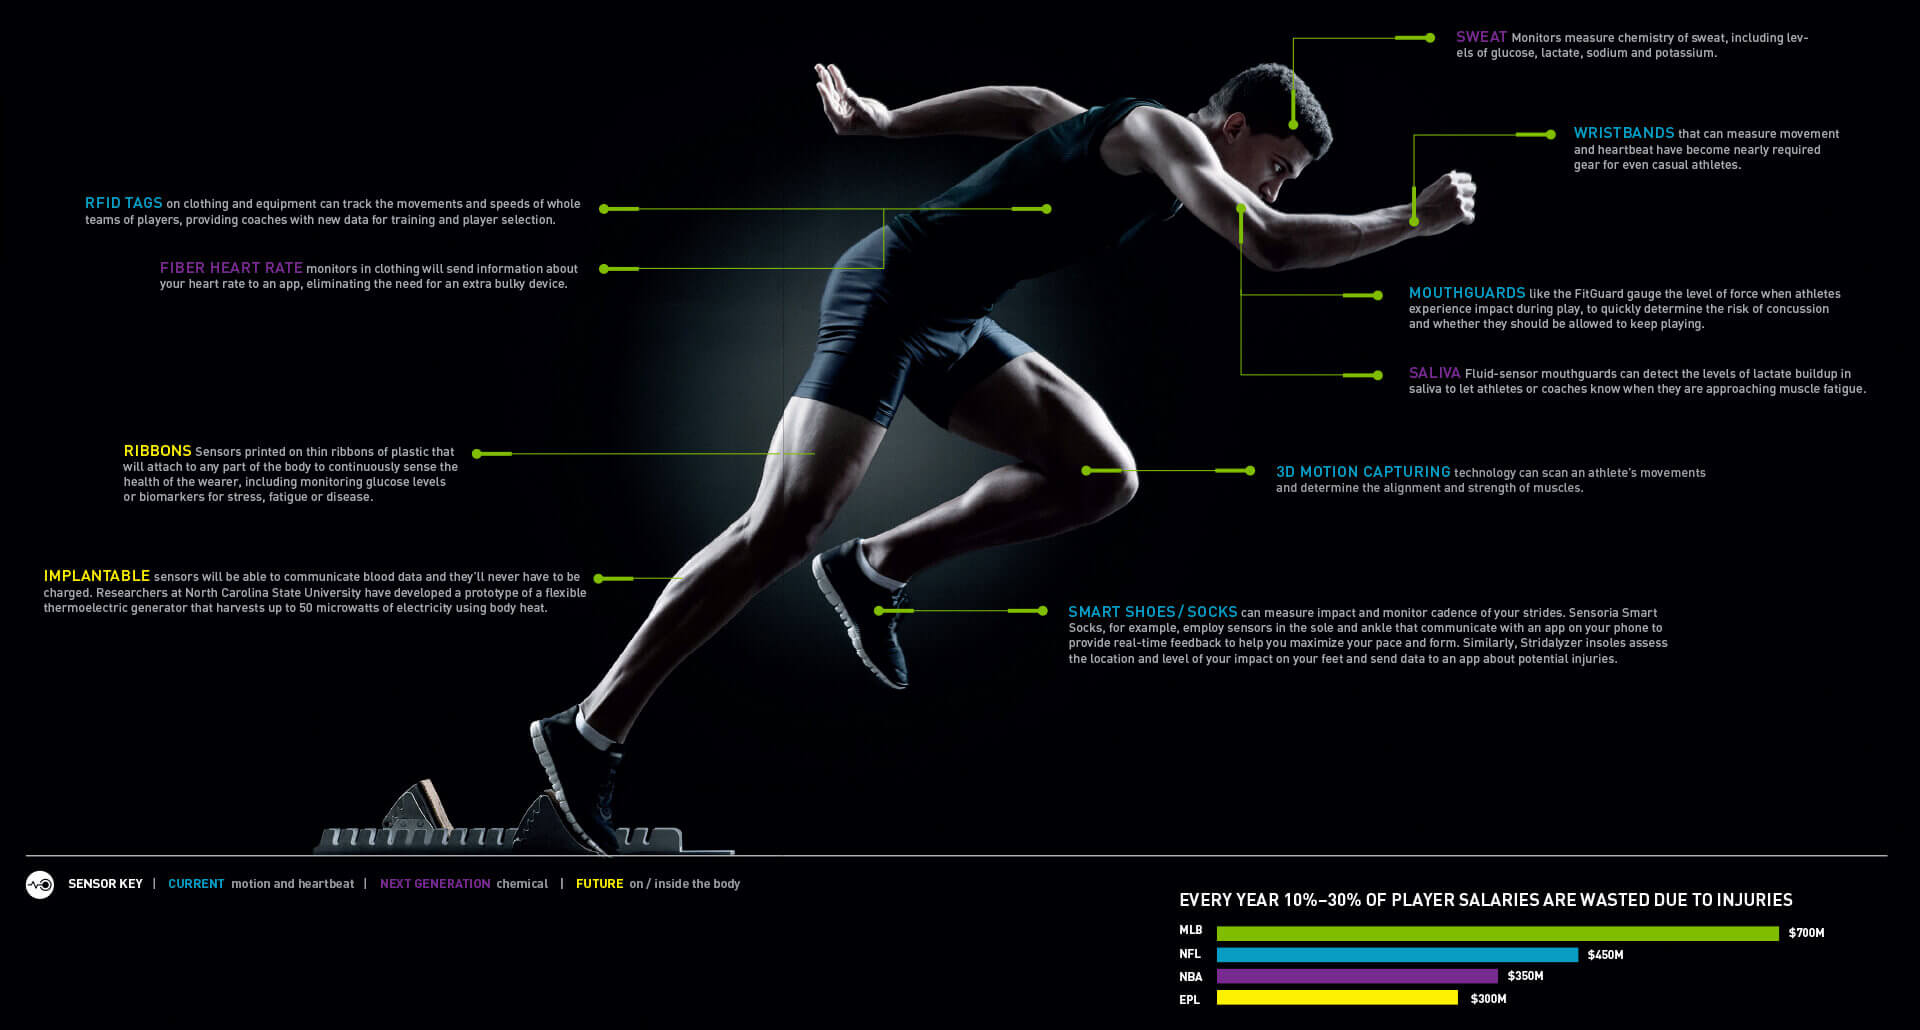
Sensor Data
Historically, sensor data has been used to monitor workload during training weeks to pinpoint fitness levels. Players first wore vests, then chest straps. In two quick years, the technology has shrunk from wristbands to waist clips to sensors no bigger than a band-aid. Now a sensor can be attached as a temporary tattoo, and soon they will be commonly implanted under the skin.
But more important than the sensor size is the increasingly accurate and complex data that is being harvested. Finding once-hidden biometric patterns in individual athletes has become possible. Some players get injured when they train too hard. They have a steady slope pattern. Other players push through an upper limit, and only by training very intensely do they reach a zone where they don’t break down. They have a roller-coaster pattern. Every athlete has her own equivalent of a pitch count. With new technology, coaches can learn how hard to train an individual athlete—without overtraining.
Even “freak” injuries are avoidable. A majority of contact injuries have been considered random. Who could predict an opponent would fall in front of your player and cause him to hyperextend a knee? It turns out that fatigue significantly affects reaction time, reducing peripheral vision and increasing the odds of injury. Tired athletes incur a much higher rate of contact injuries than fit, well-rested athletes, who spot impending contact and make adjustments to avoid it.
The connection between lost dollars and lost games is quantifiable. For every $2.3 million in salary cap dedicated to players on the disabled list, the average NFL team will lose one additional game. Salary wasted on injured players accounts for as much as 89% of the variance in NFL teams’ win-loss records.

